Wireless Hospital Management System
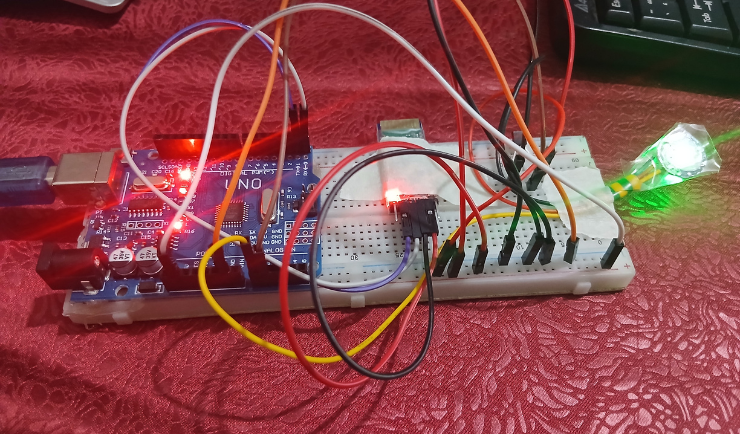
Fig 1: Hardware Setup
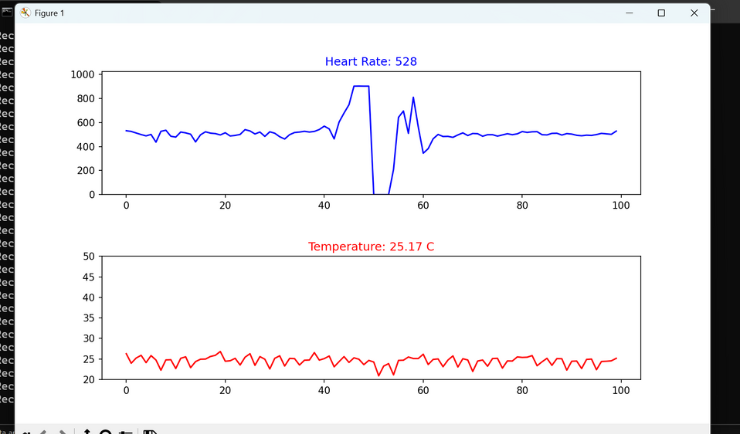
Fig 2: Software Interface
Project Overview
This project is designed to monitor patient health remotely using Arduino and Bluetooth technology. It collects real-time data like heart rate and temperature and sends it to a central Python dashboard.
Technologies Used
- Hardware: Arduino Uno, HC-05 Bluetooth Module, Pulse Sensor, LM35.
- Software: Python (Matplotlib for visualization), C++ (Arduino IDE).
Key Features
1. Real-time health monitoring.
2. Wireless data transmission.
3. Graphical representation of data using Python.
Code Snippet
import serial
import matplotlib.pyplot as plt
import matplotlib.animation as animation
from collections import deque
	# Bluetooth Connection Setup
    ser = serial.Serial(SERIAL_PORT, BAUD_RATE, timeout=1)
max_points = 100
pulse_data = deque([0] * max_points, maxlen=max_points)
temp_data = deque([0] * max_points, maxlen=max_points)
fig, (ax1, ax2) = plt.subplots(2, 1, figsize=(10, 8))
plt.subplots_adjust(hspace=0.5)

def animate(i):
			# Reading data from Arduino via Bluetooth
            line = ser.readline().decode('utf-8').strip()

            if line:
                parts = line.split(',')
                if len(parts) == 2:
                    pulse_val = int(parts[0])
                    temp_val = float(parts[1])

                    pulse_data.append(pulse_val)
                    temp_data.append(temp_val)

                    # Real-time Plotting
                    # Pulse Graph
                    ax1.clear()
                    ax1.plot(pulse_data, color='blue')
                    ax1.set_title(f"Heart Rate: {pulse_val}", color='blue')
                    ax1.set_ylim(0, 1024)

                    # Temp Graph
                    ax2.clear()
                    ax2.plot(temp_data, color='red')
                    ax2.set_title(f"Temperature: {temp_val} C", color='red')
                    ax2.set_ylim(20, 50)
ani = animation.FuncAnimation(fig, animate, interval=50, cache_frame_data=False)
plt.show()
ser.close()